Before we start with this section about what is Big Data, it is important for you to understand ‘What is Big Data?’ For that first, you need to understand what data is. So, what is data?
Data can be defined as the figures or facts which can be stored in or can be used by a computer.
Now, what is Big Data?
Now, what is Big Data?
Big Data is a term that is used for denoting the collection of datasets that are large and complex, making it very difficult to process using legacy data processing applications.
So, basically, our legacy or traditional systems can’t process a large amount of data in one go. But, how will you classify the data that is problematic and hard to process? This Hadoop tutorial will give you in-depth knowledge about What is Big Data Hadoop.
Before I give you the answer to that, let’s look at what you’d be learning in this tutorial page on ‘What is Big Data?’
- Categorizing Data as Big Data
- Major Sectors Using Big Data Every Day
- Why is Big Data so important?
- What is Big Data Analytics?
- How is Big Data Analytics used today?
- Tools for Big Data Analytics
- Benefits of Big Data Analytics
- Why Apache Hadoop?
- How did Big Data help in driving Walmart’s performance
In order to learn ‘What is Big Data?’ in-depth, we need to be able to categorize this data. Let’s see how.
Categorizing Data as Big Data
Since you have learned ‘What is Big Data?’, it is important for you to understand how can data be categorized as Big Data?
Well, for that we have five Vs:
Well, for that we have five Vs:
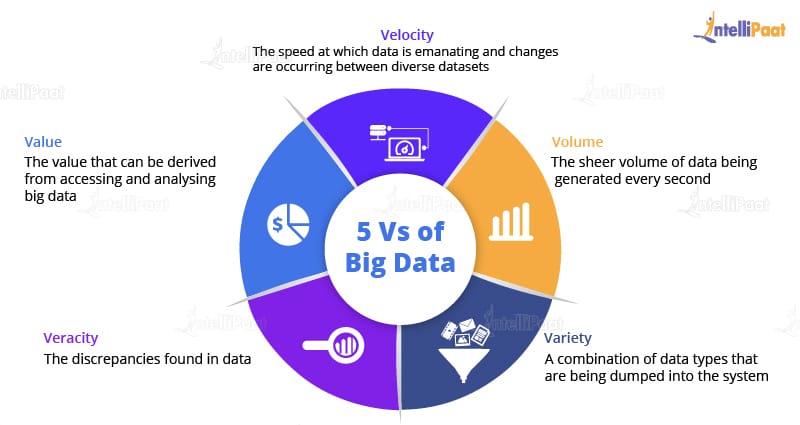
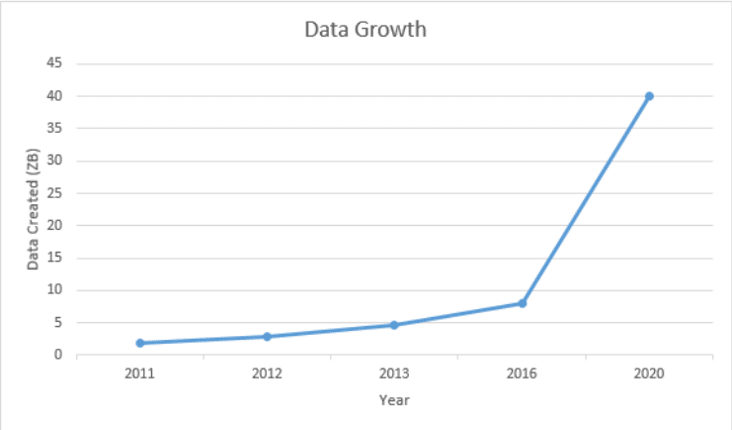
1. Volume: This refers to the data that is tremendously large. As you can see from the image, the volume of data is rising exponentially. In 2016, the data created was only 8 ZB and it is expected that, by 2020, the data would rise up to 40 ZB, which is extremely large.
2. Variety: A reason for this rapid growth of data volume is that the data is coming from different sources in various formats.
The data is categorized as follows:
The data is categorized as follows:
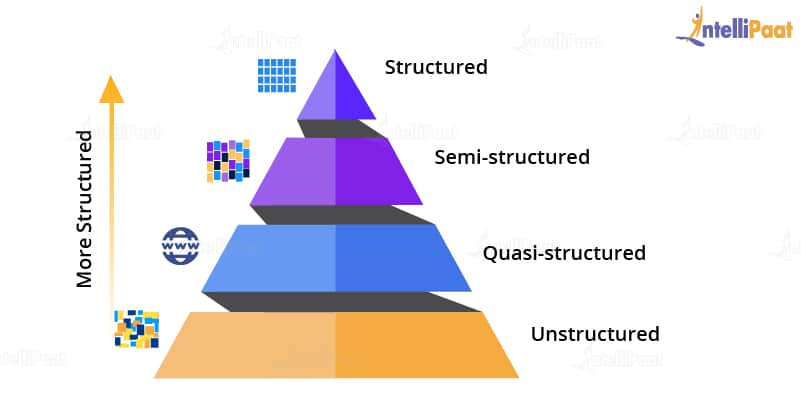 a) Structured Data: Here, data is present in a structured schema, along with all the required columns. It is in a structured or tabular format. Data that is stored in a relational database management system is an example of structured data. For example, in the below-given employee table, which is present in a database, the data is in a structured format.
| Emp ID | Emp Name | Gender | Department | Salary |
| 2383 | ABC | Male | Finance | 6,50,000 |
| 4623 | XYZ | Male | Admin | 50,00,000 |
b) Semi-structured Data: In this form of data, the schema is not properly defined, i.e., both forms of data is present. So, basically semi-structured data has a structured form but it isn’t defined, e.g., JSON, XML, CSV, TSV, and email. The web application data that is unstructured contains transaction history files, log files, etc. OLTP systems (Online Transaction Processing) are built to work with structured data and the data is stored in relations, i.e., tables.
c) Unstructured Data: In this data format, all the unstructured files such as video files, log files, audio files, and image files are included. Any data which has an unfamiliar model or structure is categorized as unstructured data. Since the size is large, unstructured data possesses various challenges in terms of processing for deriving value out of it. An example for this is a complex data source that contains a blend of text files, videos, and images. Several organizations have a lot of data available with them but these organizations don’t know how to derive value out of it since the data is in its raw form.
d) Quasi-structured Data: This data format consists of textual data with inconsistent data formats that can be formatted with effort and time, and with the help of several tools. For example, web server logs, i.e., a log file that is automatically created and maintained by some server which contains a list of activities.
3. Velocity: The speed of data accumulation also plays a role in determining whether the data is categorized into big data or normal data.
As can be seen from the image below, at first, mainframes were used wherein fewer people used computers. Then came the client/server model and more and more computers were evolved. After this, the web applications came into the picture and started increasing over the Internet. Then, everyone began using these applications. These applications were then used by more and more devices such as mobiles as they were very easy to access. Hence, a lot of data!
As can be seen from the image below, at first, mainframes were used wherein fewer people used computers. Then came the client/server model and more and more computers were evolved. After this, the web applications came into the picture and started increasing over the Internet. Then, everyone began using these applications. These applications were then used by more and more devices such as mobiles as they were very easy to access. Hence, a lot of data!
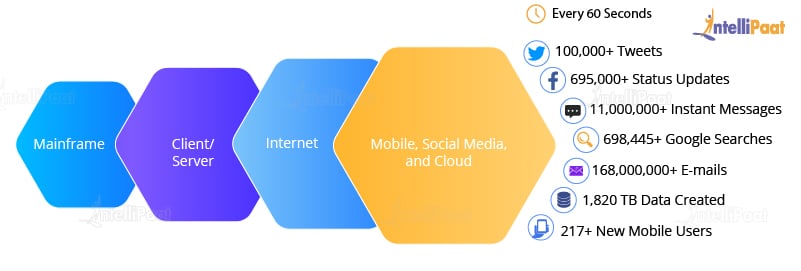
As it is clear from the image, every 60 seconds, so much of the data is generated.
4. Value: How will the extraction of data work? Here, our fourth V comes in, which deals with a mechanism to bring out the correct meaning out of data. First of all, you need to mine the data, i.e., a process to turn raw data into useful data. Then, an analysis is done on the data that you have cleaned or retrieved out of the raw data. Then, you need to make sure whatever analysis you have done benefits your business such as in finding out insights, results, etc. which were not possible earlier.
You need to make sure that whatever raw data you are given, you have cleaned it to be used for deriving business insights. After you have cleaned the data, a challenge pops up, i.e., during the process of dumping a huge amount of data, some packages might have lost.
So for resolving this issue, our next V comes into the picture.
So for resolving this issue, our next V comes into the picture.
5. Veracity: Since the packages get lost during the execution, we need to start again from the stage of mining raw data in order to convert them into valuable data. And this process goes on. Also, there will be uncertainties and inconsistencies in the data. To overcome this, our last V comes into place, i.e., Veracity. Veracity means the trustworthiness and quality of data. It is necessary that the veracity of the data is maintained. For example, think about Facebook posts, with hashtags, abbreviations, images, videos, etc., which make them unreliable and hamper the quality of their content. Collecting loads and loads of data is of no use if the quality and trustworthiness of the data is not up to the mark.
Now, that you have a sheer idea of what is big data, let’s check out the major sectors using Big Data on an everyday basis.
Major Sectors Using Big Data Every Day
Banking
Since there is a massive amount of data that is gushing in from innumerable sources, banks need to find uncommon and unconventional ways in order to manage big data. It’s also essential to examine customer requirements, render services according to their specifications, and reduce risks while sustaining regulatory compliance. Financial institutions have to deal with Big Data Analytics in order to solve this problem.
- NYSE (New York Stock Exchange): NYSE generates about one terabyte of new trade data every single day. So imagine, if one terabyte of data is generated every day, in a whole year how much data there would be to process. This is what Big Data is used for.
Government
Government agencies utilize Big Data and have devised a lot of running agencies, managing utilities, dealing with traffic jams, or limiting the effects of crime. However, apart from its benefits in Big Data, the government also addresses the concerns of transparency and privacy.
- Aadhar Card: The Indian government has a record of all 1.21 billion of citizens. This huge data is stored and analyzed to find out several things, such as the number of youth in the country. According to which several schemes are made to target the maximum population. All this big data can’t be stored in some traditional database, so it is left for storing and analyzing using several Big Data Analytics tools.
Education
Education concerning Big Data produces a vital impact on students, school systems, and curriculums. With interpreting big data, people can ensure students’ growth, identify at-risk students, and achieve an improvised system for the evaluation and assistance of principals and teachers.
- Example: The education sector holds a lot of information with regard to curriculum, students, and faculty. The information is analyzed to get insights that can enhance the operational adequacy of the educational organization. Collecting and analyzing information of a student such as attendance, test scores, grades, and other issues take up a lot of data. So, big data makes an approach for a progressive framework wherein this data can be stored and analyzed making it easier for the institutes to work with.
Big Data in Healthcare
When it comes to what Big Data is in Healthcare, we can see that it is being used enormously. It includes collecting data, analyzing it, leveraging it for customers. Also, patients’ clinical data is too complex to be solved or understood by traditional systems. Since big data is processed by Machine Learning algorithms and Data Scientists, tackling such huge data becomes manageable.
- Example: Nowadays, doctors rely mostly on patients’ clinical records, which means that a lot of data needs to be gathered, that too for different patients. Obviously, it is not possible for old or traditional data storage methods to store this data. Since there is a large amount of data coming from different sources, in various formats, the need to handle this large amount of data is increased, and that is why the Big Data approach is needed.
E-commerce
Maintaining customer relationships is the most important in the e-commerce industry. E-commerce websites have different marketing ideas to retail their merchandise to their customers, to manage transactions, and to implement better tactics of using innovative ideas with Big Data to improve businesses.
- Flipkart: Flipkart is a huge e-commerce website dealing with lots of traffic on a daily basis. But, when there is a pre-announced sale on Flipkart, traffic grows exponentially that actually crashes the website. So, to handle this kind of traffic and data, Flipkart uses Big Data. Big Data can actually help in organizing and analyzing the data for further use.
Social Media
Social media in the current scenario is considered as the largest data generator. The stats have shown that around 500+ terabytes of new data get generated into the databases of social media every day, particularly in the case of Facebook. The data generated mainly consist of videos, photos, message exchanges, etc. A single activity on any social media site generates a lot of data which is again stored and gets processed whenever required. Since the data stored is in terabytes, it would take a lot of time for processing if it is done by our legacy systems. Big Data is a solution to this problem.
Let’s now continue our what is big data tutorial by checking out why Big Data is important to us that we are so concerned about it.
Why is Big Data so important?
Although big data may not immediately kill your business, neglecting it for a long period won’t be a solution. The impact of big data on your business should be measured to make it easy to determine a return on investment. Hence, big data is a problem definitely worth looking into.
Whenever you visit a website, you might have noticed that on the right panel or top panel or somewhere on the screen, you will find a recommendation field which is basically an advertisement that is related to your preferences. How does the advertisement company know that you would be interested in it?
Well, everything you surf on the Internet is stored and all this data is analyzed properly so that whatever you are surfing for or you’re interested in comes up. Obviously, you will be interested in that particular advertisement and you will be surfing further. But, mind you! The amount of data generated from a single user is so huge that it is considered as big data.
Well, everything you surf on the Internet is stored and all this data is analyzed properly so that whatever you are surfing for or you’re interested in comes up. Obviously, you will be interested in that particular advertisement and you will be surfing further. But, mind you! The amount of data generated from a single user is so huge that it is considered as big data.
The following image shows two advertisements popping up.
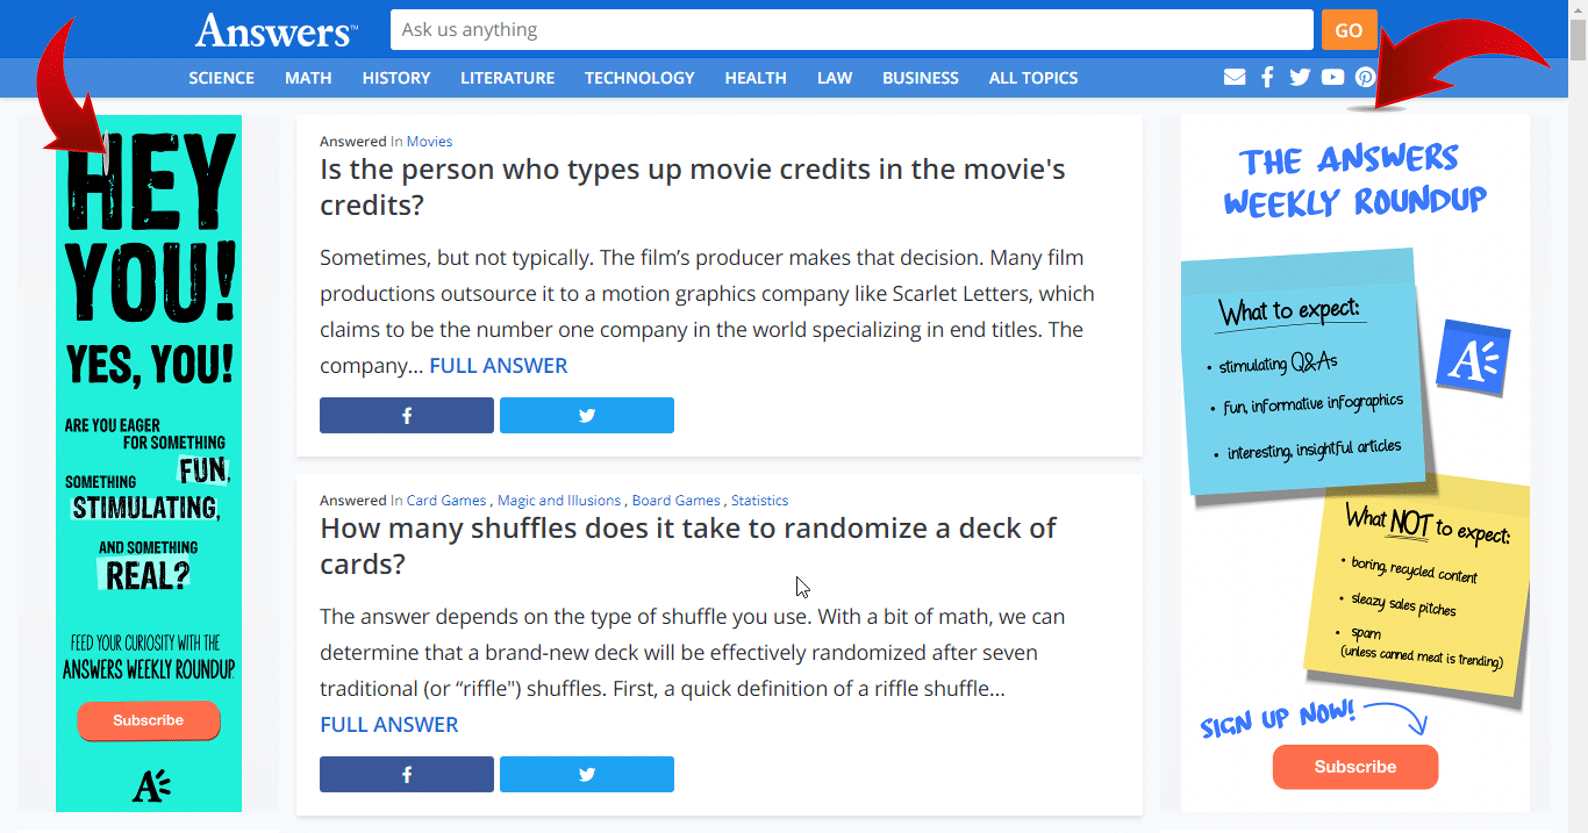
Have you ever noticed when you go to YouTube, YouTube knows what kind of videos you would like to watch and what you must be looking for next? Similarly, Amazon shows you the type of products you must be looking to buy. Even if you would have searched for a pair of earphones, you will keep on getting the recommendation of earphones, again and again, that too on different websites.
How does this happen?
It happens because of Big Data Analytics.
What is Big Data Analytics? Let’s learn about this next in our What is Big Data tutorial.
What is Big Data Analytics?
Big Data Analytics examines large and different types of data in order to uncover the hidden patterns, insights, and correlations. Basically, Big Data Analytics is helping large companies facilitate their growth and development. And it majorly includes applying various data mining algorithms on a certain dataset.
How is Big Data Analytics used today?
Big Data Analytics is used in a number of industries to allow organizations and companies to make better decisions, as well as verify and disprove existing theories or models. The focus of Data Analytics lies in inference, which is the process of deriving conclusions that are solely based on what the researcher already knows.
Let us now see a few of the Big Data Analytics tools.
Tools for Big Data Analytics
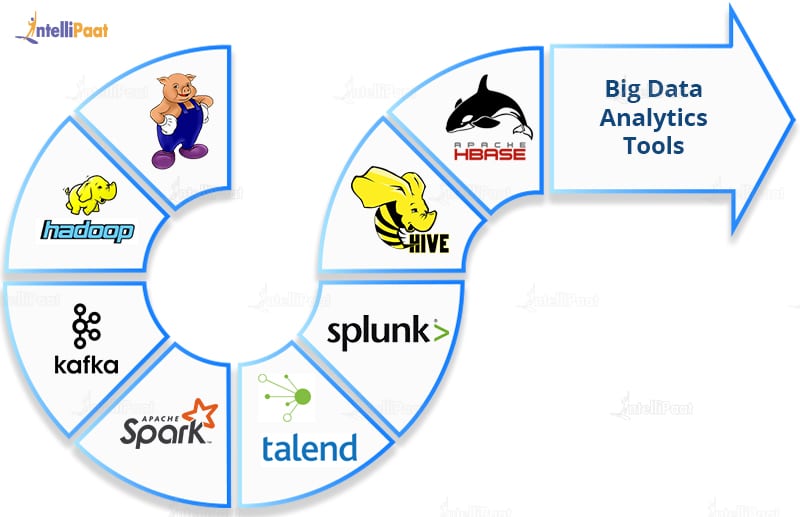
- Apache Hadoop
Big Data Hadoop is a framework that allows you to store big data in a distributed environment for parallel processing. - Apache Pig
Apache Pig is a platform that is used for analyzing large datasets by representing them as data flows. Pig is basically designed in order to provide an abstraction over MapReduce which reduces the complexities of writing a MapReduce program. - Apache HBase
Apache HBase is a multidimensional, distributed, open-source, and NoSQL database written in Java. It runs on top of HDFS providing Bigtable-like capabilities for Hadoop. - Apache Spark
Apache Spark is an open-source general-purpose cluster-computing framework. It provides an interface for programming all clusters with implicit data parallelism and fault tolerance. - Talend
Talend is an open-source data integration platform. It provides many services for enterprise application integration, data integration, data management, cloud storage, data quality, and Big Data. - Splunk
Splunk is an American company that produces software for monitoring, searching, and analyzing machine-generated data using a Web-style interface. - Apache Hive
Apache Hive is a data warehouse system developed on top of Hadoop and is used for interpreting structured and semi-structured data. - Kafka
Apache Kafka is a distributed messaging system that was initially developed at LinkedIn and later became part of the Apache project. Kafka is agile, fast, scalable, and distributed by design.
Benefits of Big Data Analytics
Big Data Analytics is indeed a revolution in the field of Information Technology. The use of Data Analytics by various companies is increasing every year. The primary focus of them is on their customers. Hence, the field is flourishing in Business-to-Consumer (B2C) applications.
Why Apache Hadoop?
Most database management systems are not up to the mark for operating at such lofty levels of Big Data requirements either due to the sheer technical inefficiency or the insurmountable financial challenges posed. When the type of data is unstructured, the volume of data is huge, and the results needed are at uncompromisable speeds, then the only platform that can effectively stand up to the challenge is Apache Hadoop.
Hadoop owes its runaway success to a processing framework, MapReduce, that is central to its existence. MapReduce technology lets ordinary programmers contribute their part where large datasets are divided and are independently processed in parallel. These coders need not know the nuances of high-performance computing. With MapReduce, they can work efficiently without having to worry about intra-cluster complexities, monitoring of tasks, node failure management, and so on. We shall be learning about MapReduce in the following section on this Hadoop tutorial.
Now in this What is Big Data Hadoop Tutorial, let’s understand how Walmart used Big Data to increase its sales.
Interested in learning ‘What is Big Data Hadoop?’ Check out the Big Data Hadoop Training in Sydney!
How did Big Data help in driving Walmart’s performance?
Walmart, one of the Big Data companies, is currently the biggest retailer in the world with maximum revenue. Consisting of 2 million employees and 20,000 stores, Walmart is building its own private cloud in order to incorporate 2.5 petabytes of data every hour.

Walmart has been collecting data of products that have the maximum sales in a particular season or because of some specific reason. For example, if people are buying candies during the Halloween season, along with costumes, you’d see a lot of candies and costumes all around Walmart only during the Halloween season. This it does based on the Big Data Analytics it had made for the previous years’ Halloween seasons.
Again, when in 2012, Hurricane Sandy hit the US it was analyzed by Walmart, from the data it had collected and analyzed from such previous instances, that people generally buy emergency equipment and strawberry pop-tarts when a warning for an approaching hurricane is declared. So, this time too, Walmart quickly filled its racks with the emergency equipment people would require during the hurricane in the red alert areas. This made the selling of these products very quick and Walmart gaining a lot of profit.
By this, our second section of the Hadoop tutorial comes to an end. In this section of What is Big Data Hadoop tutorial, we learned ‘What is Big Data?’ and discussed about Big Data Analytics, Big Data technologies, Big Data tools, and so on. In the next session on this Hadoop tutorial, we will be learning about Hadoop in detail.
Nice post devops online training
ReplyDelete